The Line Chart Page
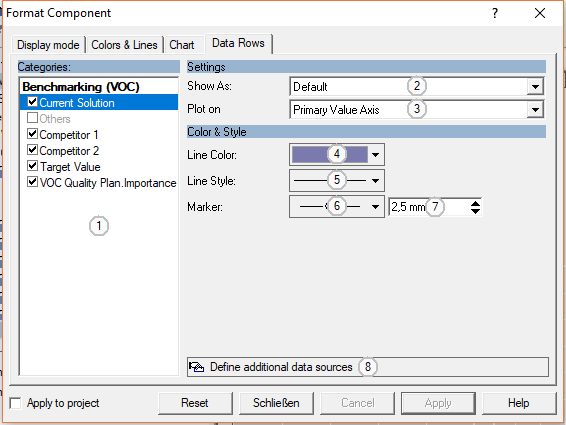
This page contains controls to setup the style and color for each data row in a line chart. Table columns of the underlying table can be hidden and columns from other tables can be imported into the diagram.
Control Elements:
1
Select a table column here. Use the checkbox to enable / disable a column.
2
Choose the display type for this data columns. Default refers to the basic type of the chart: lines or bars. Choose another type to override this basic type.
3
Choose either the primary or secondary value axis.
4
Select a color for the line
5
Select a style for the line
6
Select a symbol for each data point
7
Enter the size of the marker in mm
8
Click here to choose columns from other tables.See
The Select Columns Dialog for details.
See Also...
Feedback
Did you find what you needed?
If you have any further questions or suggestions to improve this page, please let us know: