User Interface
The Bar Chart Page
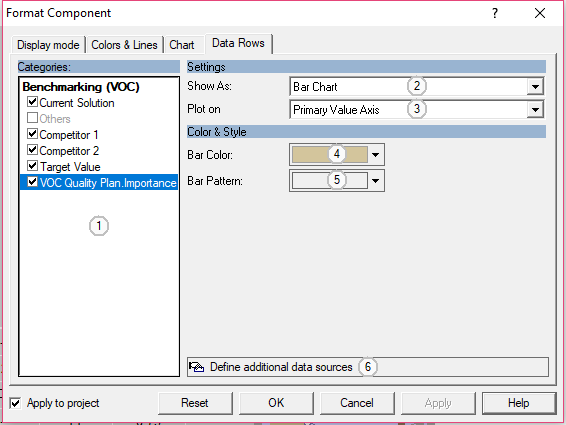
The Bar Chart Page
This page contains controls to define color and style for bar charts as well as controls to change the chart type for a data row and to add new data rows.
Control Elements:
See Also...
Feedback
Did you find what you needed?
If you have any further questions or suggestions to improve this page, please let us know: