About P-Diagram
The P-Diagram is used to collect noise and control factors potentially affecting a system function / functional requirement.

Identify external factors that might impact system robustness

A P-Diagram returns a list of noise and control factors. These are intended as an input for design verification planning or Design of Experiments.
How to insert the P-Diagram component
The P-Diagram template can be used to start new projects or to extend existing projects. Please read chapter "The Templates" to learn more about how to start new projects.
In order to extend your project:
- Activate the Home Ribbon

- Click the Add Tool button on the Home ribbon
- Click the P-Diagram icon in the template catalog
In order to find the P-Diagram component within the template catalog, you have to choose a cycle name on the first line of the screen and a phase name at the left of the screen. The P-Diagram component is located in this cycle/phase combinations:
- DFSS DMADV: DESIGN
- DFSS IDOV: OPTIMIZE
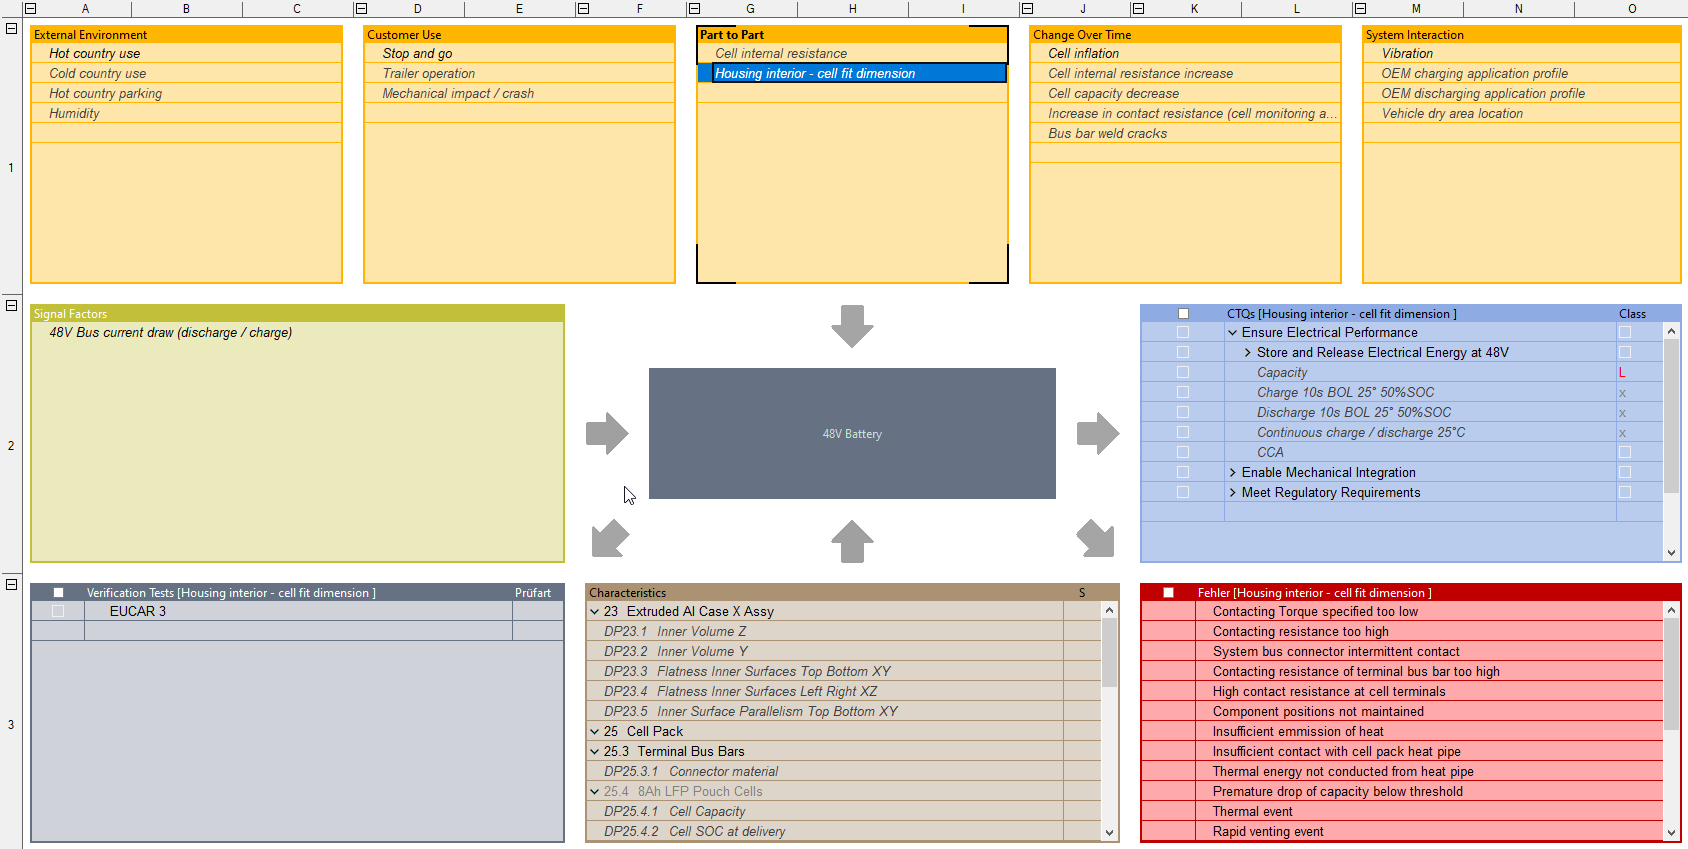
Qualica Software supports the P-Diagram by means of a specialized editor form. In addition to collecting the input and output factors, the P-Diagram form can also be used to document how the different factors are related together. This information is re-used in many other components inside the DFSS system. For printing and reporting, the form creates a graphical representation of the P-Diagram.

The P-Diagram form has list box controls for the 5 types of noise factors, signal factors, CTQs, Characteristics (Control Factors), and possible Failures. In addition a box for the intended verification tests lets you edit the experiments intended to verify the reaction on the different noise factors. This information can later be used by the Robustness Checklist.
List Boxes
All list boxes work in the same way as the simple outline view of a tree or the side-by-side editor. Use the Insert buttons on the Home ribbon to add new items or click the empty last line of a list. Use drag&drop to change the tree structure.
- Noise Factors: The first row contains list boxes for each of the 5 noise factor categories.
- Signal Factors: located at the left middle part of the form you can enter the important signal factors here
- Characteristics: at the lower center of the form, this is in fact the tree of design elements. Usually the top hierarchy level will show the parts and components of the system. Add the design parameters, e.g. length / height, etc. as children of the design elements.
- CTQs: this is the tree of functional requirements as already used in the House of Quality. The CTQs are placed at the right middle of the form.
- Failures: at the right bottom you can find the list of error states. This list is identical to the possible failures, causes, and effects used in FMEA
- Verification Tests: located at the lower left, this is a new list of intended experiments. Each experiment should verify the system's reaction on one or more noise factors listed in the top row
Information developed with a P-Diagram can be used as input for other methods.
- Use control and noise factors listed to plan experiments and simulations returning robust parameter settings. A Component Design Matrix can be used to support this process.
- Use noise factors and design verification methods to identify potential gaps in the design verification plan (DVP). The Robustness Checklist can be used to support this process.
- Align Noise factors and faults (error states) with FMEA:
- Verify all faults (error states) identified on the P-diagram, together with the noise factors potentially causing them, are included in FMEA.
- Verify all designed verification methods linked to noise factors and faults are included in FMEA as detection controls.
Worksheets
ctq_selection

String 280859
CTQs
FR Importance
FR Specs
P-Diagram (Form)

Need more information? Open questions? Please let us know.