Templates
Pugh Matrix

About Pugh Matrix
The Pugh matrix rates concepts against requirements. It is also known as concept scoring matrix. Requirements may or may not be weighted.

Assess alternative overall concepts with respect to requirements

A score for each concept is returned. The score can be used to eliminate weaker concepts or to select a winner.
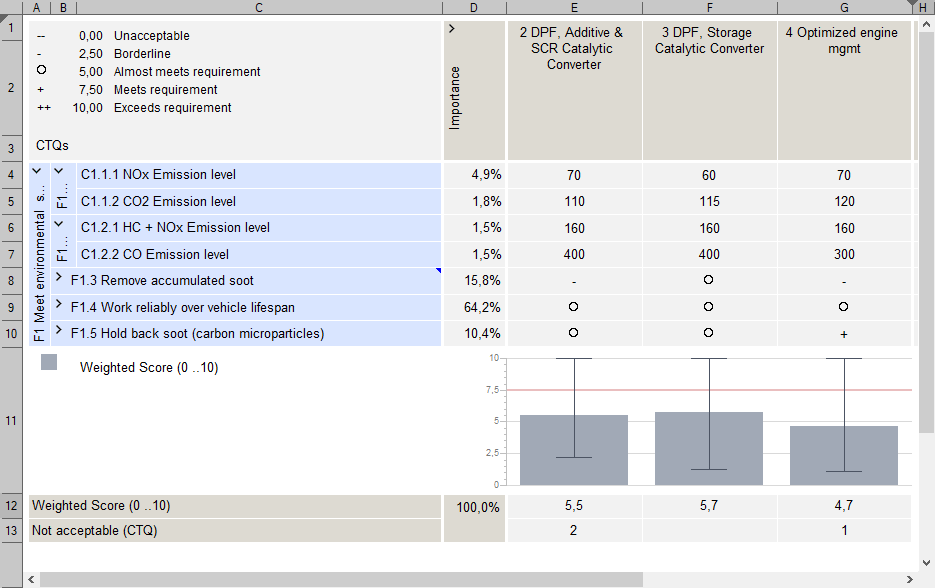
Evaluation of Concepts versus Critical to Quality (CTQ) requirements on a ++ to -- scale.
Qualica Software supports two types of Pugh-Matrices: One based on technical requirements, one based on customer requirements.
Enter the planned target values for each criterion in the same way as you did it in the benchmarking table. For technical criteria (CTQs) you can enter actual values as long you have filled out the benchmarking range part in the technical benchmarking. For customer requirements or technical criteria where no scale has been defined, use the drop-down button of the cells to select a scoring symbol (-- no compliance up to ++ full compliance).
Recalculation will create a total score for each concept and some additional information. All results are shown below the main scoring table:
- Weighted Score: This is the calculated total score in a range from 0 to 10. The percentage value at the beginning tells you, which faction of the total importance of 100% has been considered in the calculation. Scores cannot be calculated for incomplete or empty rows in the table.
- Not acceptable: This is a count of all constraints that have not been fulfilled by a concept. Mark a criterion as constraint, if it cannot be change, e.g. if it is regulated by law. Concepts with a count > 0 are not acceptable, no matter how high the total score might be.

Worksheets
Pugh Matrix (CTQs)

CTQs
FR - Functional Requirements: Structure of functions and technical requirements (critical to quality, CTQ).Importance
Importance: Importance score for each function / ctq. Usually coming from other modules, e.g. AHP.Pugh Matrix
Pugh Table: Enter a score for each requirement and concept. Use the drop-down-list or a keyboard shortcut to select a score (-- [Shift]+[2], - [Shift]+[1], o [0], + [1], ++ [2]). For technical requirements it is also possible to enter real measurements. This requires the range table in technical benchmarking being filled out.Specifications
Specifications: Enter details for each requirement here. Use the details slider in the status bar to display more or less details.Chart
The diagram shows importance values and variances for all criteria as bars. The scores for each concept are shown as line graphs. Data is re-scaled to a 10 point scale.Concept Scoring
Result: Shows calculated results from the pugh table, e.g. weighted score, sum of + / -, etc.Results
Results Chart: Shows the total score of each concept as a bar. The "whiskers" display a confidence interval.Guide
Variant (optional)
Choose one of the defined variantsConcept
Choose the winning concept. All further project steps will refer to this concept.
Roadmap
More Worksheets
Need more information? Open questions? Please let us know.