The Axis Page
The Axis Page controls the value range, unit and display position of an axis in a chart.
Control Elements:
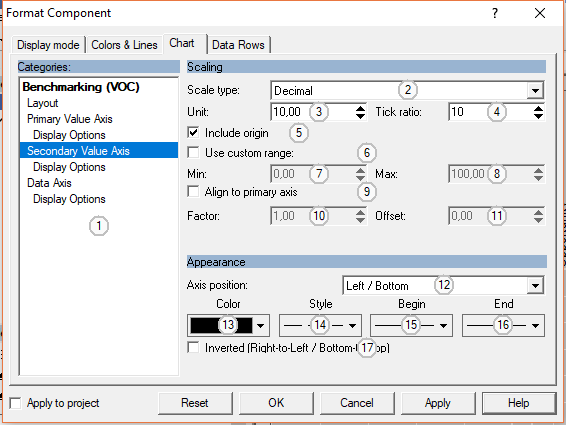
1
Select a category or section of the current component here.
2
Select a scale type for the axis (decimal, logarithmic, percentage)
3
Set the unit (major ticks) for the axis
4
Set the tick ratio (number of minor ticks for each major tick)
5
Check to make sure that the value 0 is in the automatically calculated range of the axis
6
Check to specify a custom range for the axis
7
Edit the minimum of the axis range
8
Edit the maximum of the axis range
9
For secondary axes: set range relatively to range of primary axis
10
Set the scale factor for calculating the range of a secondary axis from the primary axis
11
Set the offset for calculating the range of a secondary axis from the primary axis
12
Select a display position for the axis
13
Select the color for the axis, ticks, and arrow
14
Select a line style for the axis
15
Select an arrow for the starting point of the axis
16
Select an arrow for the end point of the axis
-
Feedback
Did you find what you needed?
If you have any further questions or suggestions to improve this page, please let us know: