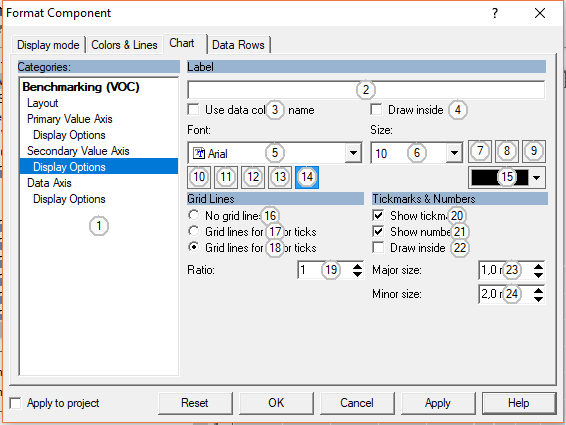
The Axis Display Page
The Axis Display Page contains controls to set more options to draw axes in a chart.
Control Elements:
1
Select a category or section of the current component here.
2
Enter the text to show near the axis
3
Check to use the name of the underlying data column as label
4
Show axis labels above / right of the axis
-
6
Choose or edit a font size. Sizes are given in points.
-
-
-
-
-
-
-
14
Enable automatic line breaks
15
Click here to select the text color.
-
17
Show grid lines at each minor tick
18
Show grid lines for each major tick
19
Ratio of grid lines to ticks (grid lines for each x'th tick)
-
21
Show value for each major tick
22
Show ticks above / right of axis
23
Size of minor ticks in mm
24
Size of major ticks in mm
Feedback
Did you find what you needed?
If you have any further questions or suggestions to improve this page, please let us know: